Individual game performance this season vs last season
Readers of this blog will likely be comfortable with the idea that one way in which we tend to mis-evaluate a player's performance to date is to focus too much on outcomes and not enough on process i.e. on goals and not shots. This problem, of course, is what stats like expected goals (xG) try to combat, as does simply looking at underlying stats rather than focusing on goals or assists.
Another area for caution is to adjust for the opponents an individual player has faced. A player may well be good value for their 3 goals in 3 games based on their underlying stats, but if those all came in games against Crystal Palace, Bournemouth and Swansea then it doesn't necessarily mean they will enjoy future success when the opponents get tougher. This is implicitly factored into the player projections, which are based on individual opponents but there are holes in the model that can need to be recognized.
For example, the model allocates a team's projected shots to individual players based on the percentage of their teams shots they have accounted for in the past, but what about the scenario where a player feasts on weaker sides, accounting for 30-40% of his team's total shots, but goes quiet against the stronger sides? This is a fairly nuanced point and one that isn't immediately obvious how to embed in a model across the entire population.
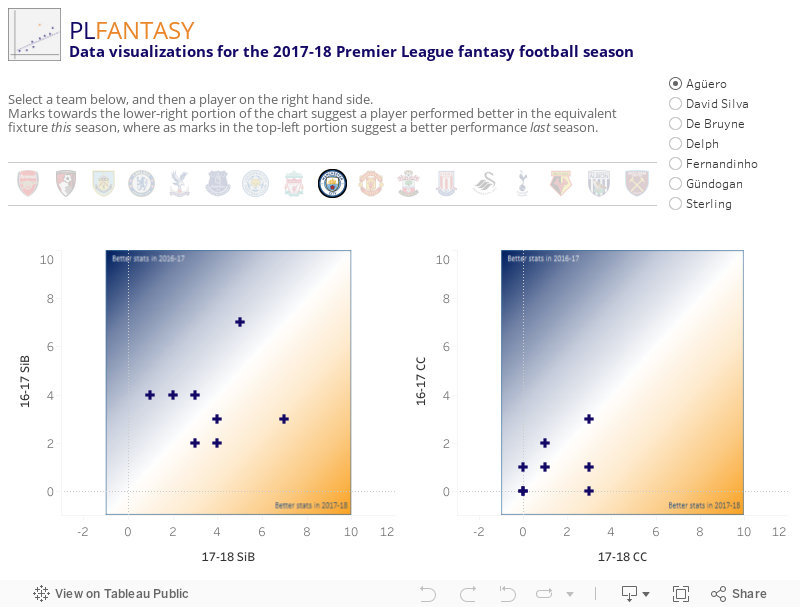
The below visualization therefore attempts to fill this void a bit, just as a sense check for how you think an individual player has been performing. Each player's SiB and CC in games this season are plotted against how they performed in the respective fixture last season. We're only showing games where a player logged more than 45 minutes in each fixture, so you won't necessarily see every game from this season on there. More marks in the bottom-right, orange section speak to a player who has been stronger against a like-for-like fixture in the current campaign (see Harry Kane's SiB) where as more marks towards the top left show that they performed better last season (see Nathan Redmond's SiB). Hovering over each mark will show the opponent and in aggregate can help build a bit of nuance as to where the player is succeeding or failing this season compared to last.
Another area for caution is to adjust for the opponents an individual player has faced. A player may well be good value for their 3 goals in 3 games based on their underlying stats, but if those all came in games against Crystal Palace, Bournemouth and Swansea then it doesn't necessarily mean they will enjoy future success when the opponents get tougher. This is implicitly factored into the player projections, which are based on individual opponents but there are holes in the model that can need to be recognized.
For example, the model allocates a team's projected shots to individual players based on the percentage of their teams shots they have accounted for in the past, but what about the scenario where a player feasts on weaker sides, accounting for 30-40% of his team's total shots, but goes quiet against the stronger sides? This is a fairly nuanced point and one that isn't immediately obvious how to embed in a model across the entire population.
The below visualization therefore attempts to fill this void a bit, just as a sense check for how you think an individual player has been performing. Each player's SiB and CC in games this season are plotted against how they performed in the respective fixture last season. We're only showing games where a player logged more than 45 minutes in each fixture, so you won't necessarily see every game from this season on there. More marks in the bottom-right, orange section speak to a player who has been stronger against a like-for-like fixture in the current campaign (see Harry Kane's SiB) where as more marks towards the top left show that they performed better last season (see Nathan Redmond's SiB). Hovering over each mark will show the opponent and in aggregate can help build a bit of nuance as to where the player is succeeding or failing this season compared to last.

Comments