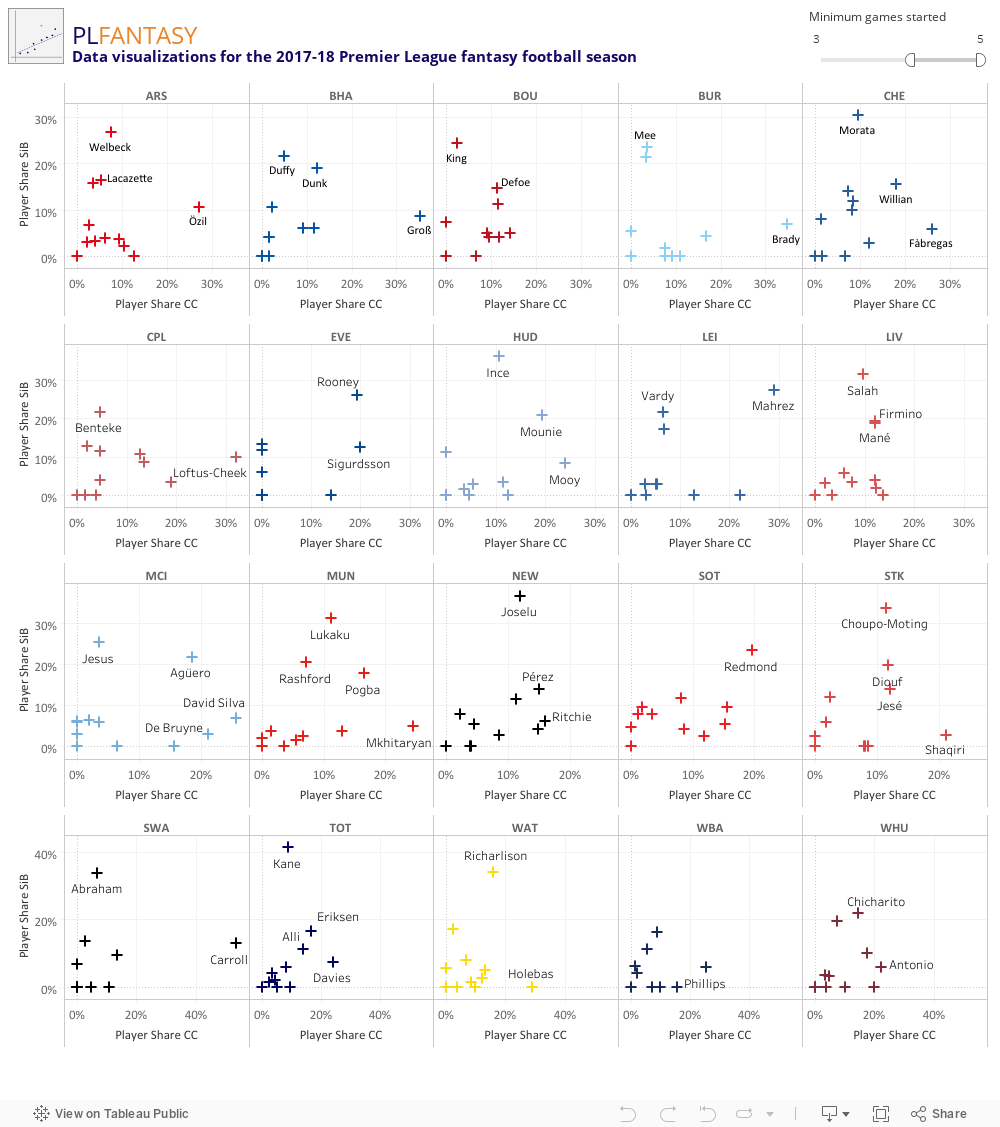
Player share of key stats, by team
The below visualization shows the share of their team's shots inside the box (SiB) and created chances (CC) each player have accounted for this season. The share represents only the games when the player was on the field so as to not penalise them for missing games. This also therefore means that the total team percentage will not add up to 100%.
While shots inside the box are generally more valuable than those from outside, this data does not control for quality beyond that, so an overly trigger happy player like Andy Carroll might appear more valuable than he is, while a clinical finisher like Aguero might be underrated. Still, the idea here is provide a quick sense check as to where players rank within their respective teams.
We often see people cite team A's superior fixtures to team B as the key reason to select player A over player B, but this misses the impact of the likelihood of these players benefiting from their team's favourable fixtures, which I hope this player share data can help with a bit.

Comments