What's happening in Salford?
Regular readers will know that one of the key drivers behind my team goal model (which ultimately backs up a lot of the individual player data too) is based on shot totals, split between those inside and outside the box. I like shots on target too, of course, but the reason I have opted for total shots in the model is for fear that over a short period, shots on target can be a bit misleading for individual players as, just as we wouldn't expect a player to score every time he hits the target, we equally wouldn't expect him to actually hit the target every time either.
With that in mind, I want to draw your attention to some interesting shot data from this and last year and open up the floor to suggestions as to (a) what is going on and (b) how we should deal with it next year. You'll notice that a lot of the posts for these remaining few weeks are going to be a bit more 'blue sky' than normal, mainly because there's only so many times you can write up the same lineup lessons are suggest that Michu is due for regression.
To start then, let's look at some likely familiar charts from prior year, first showing the strong relationship between created chances and shots inside the box and then between shots inside the box and goals:
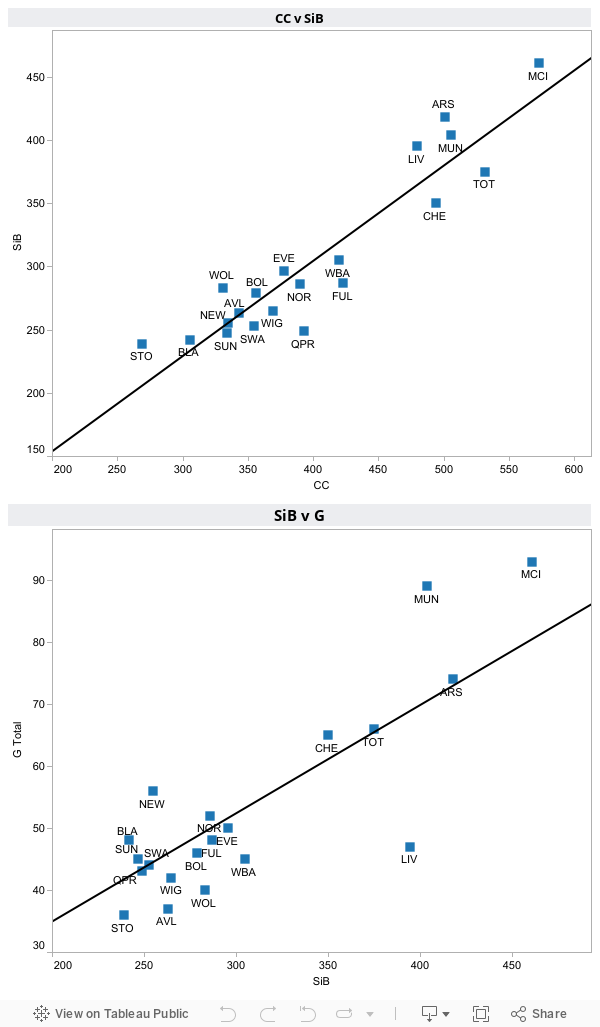 The first chart actually shows a slightly stronger correlation than expected as I thought it was reasonable for teams to rack up 'created chances' without necessarily registering a good shot on goal. Anyway, that strength of relationship suggests created chances should probably feature more heavily in the next model as a way of normalizing SiB. The second chart plots SiB against goals and shows a slightly weaker relationship that I had in mind but an r-squared of 0.72 suggests there's enough here to still rely on. The variance between expected and actual goals per this trend line were as below:
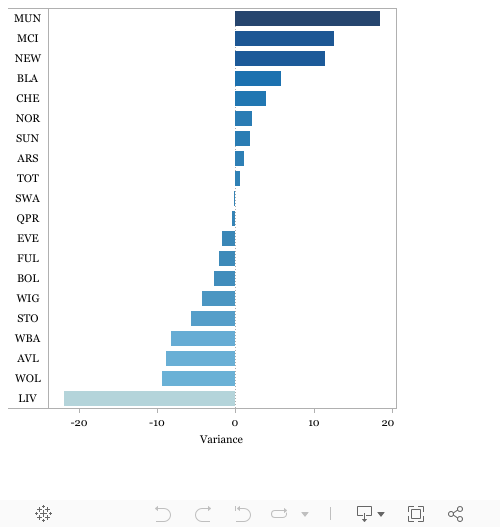 The relationship is far from concrete but generally it looks like the better teams were out shooting the expected goals while the poorer teams struggled to meet expectations (Blackburn and to a degree Liverpool were the key exceptions there. In short though, there's a decent relationship here with a couple of exceptions to keep in mind. Let's move onto this year then:
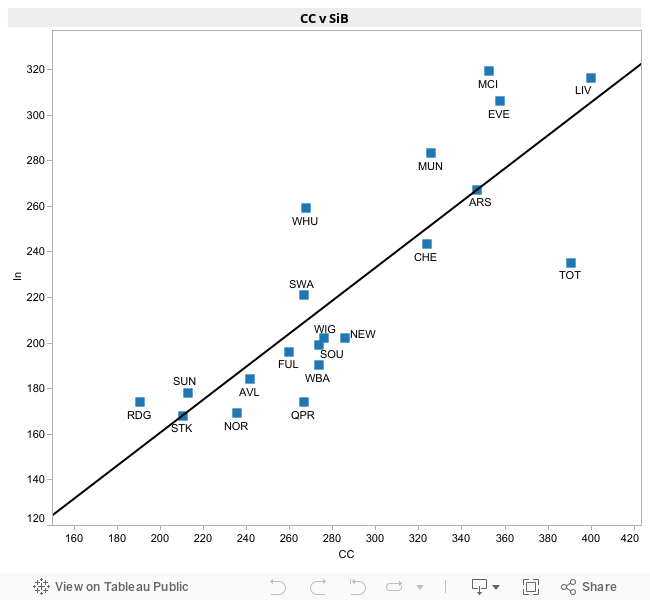 So far, so good as once again we see a strong relationship between chances created and total goals. This again suggests that the better teams who enjoy good possession in dangerous areas and/or threaten from deep balls into the box are getting more SiB and thus goals. The tricky point comes with the next chart though:
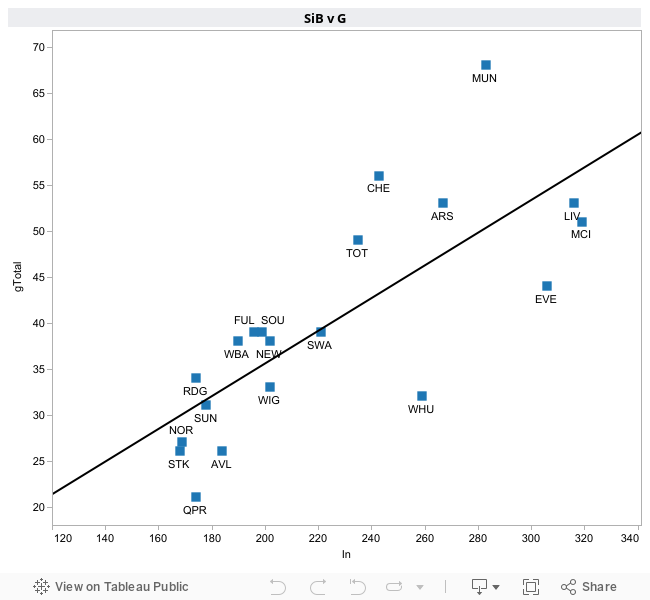 What on earth is happening with Man Utd here (the title of this post was a little dig at United's location in the North West for those outside of the UK)? Again, let's look at the variance from the line of best fit:
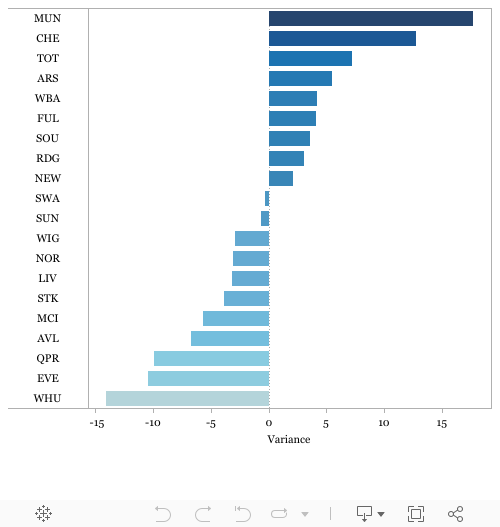 Once again United are the largest outlier and the only team who have really shown any consistency to over or under perform the SiB forecast goals over the two seasons (Villa's underperformance looks like the next closest match).
This is the point where the analysis ends and the speculation begins. We can all think of subjective reasons why this is the case for United, but are any of them backed up by stats:
With that in mind, I want to draw your attention to some interesting shot data from this and last year and open up the floor to suggestions as to (a) what is going on and (b) how we should deal with it next year. You'll notice that a lot of the posts for these remaining few weeks are going to be a bit more 'blue sky' than normal, mainly because there's only so many times you can write up the same lineup lessons are suggest that Michu is due for regression.
To start then, let's look at some likely familiar charts from prior year, first showing the strong relationship between created chances and shots inside the box and then between shots inside the box and goals:
This is the point where the analysis ends and the speculation begins. We can all think of subjective reasons why this is the case for United, but are any of them backed up by stats:
- They have the best forwards, who are the most clinical and thus convert equally promising shots as other teams but at a higher rate
- They create better chances than other teams which are thus easier to convert
- They've simply enjoyed a couple of seasons where they've out scored their underlying stats and thus could regress
- Something else
With almost two full seasons of data I think we're at a point where it's unlikely that United are simply getting lucky but I haven't been able to locate anything in the data to concretely prove, and the predict what in their game makes them so much more efficient with their chances. Once again, I throw the question out to the readers to see what we can come up with.

Comments
Having two forwards gives you the flexibility to play one of them out of position, and yet have another, who's ready to finish, inside the D.
Also, with regards to Suarez and Sturridge, Liverpool are actually below average in terms of goals per SiB. And last year they were horrific, even with Suarez in the team. There's more to this than just player ability, with the obvious answer being who's creating the chances and from where.
On first glance the answer seems obvious but quantifying isn't so easy.
1. Converting possession into chances
2. Converted chances into shots
3. Making those shots come from quality positions (i.e. inside the box)
4. Hitting the target with the shots
5. Scoring with SoT (from my research to date there is a LARGE slice of luck in this factor)
I suspect that 3 is the most important but will run the numbers on 4 to try and isolate the answers.
I wonder, is there a big difference between headed conversion rate and "normal" shot (in the box) conversion rate? And if so, are those numbers easily separated/obtained? It wouldn't explain Manchester City or Liverpool's poor performance this year (maybe that IS bad luck?), but it could explain West Ham and Everton's (Fellaini) relatively low goals scored per shots in the box, if headed efforts are converted less often.
Where as a better team like Man Utd. or in recent years a Spain or Barcelona would continue to play in their normal fashion until the right chance came along.
It could be worth looking along with headers the proportion of defenders taking those shots for the teams below the line of best fit.
If you look at Rooney and RVP's conversion rates from previous season and they aren't too special. RVP's G:SOT last year was in line with averages.
I've looked at coversion of headers too - thoguht I was on to something, bue alas the average conversion rate for headers in no different than shots, was actually higher although I did not do seperate team analysis. My assumption on headers though was that headers on target would actually have a higher conversion rate than shots cos you can't really have a header from outside the box. A header on target is most likley from close trange from a cross and really gives the keeper little chance unless it's straight at him. However, as said, the avg. conversion rate was the same.
I think with United it's about the speed and quality of their passing. And I think this has a lot to do with MICHAEL CARRICK.
One metric I have toyed with I called Strike Rate - it's a how often a team shoot compared to pass in the final 3rd. Team's like ARS and CITY suffer because they build up slowly and allow teams to get back to defend whereas Utd have always been able to rip teams open at great pace.
Which other team has a deep lying playmaker like CARRICK? City don't, with Milner/Garcia/Barry in that role they rely on Silva further up. Chelsea don't, Arsenal almost do in Arteta but he hasn't got the long pass that Carrick does. Gerrard's can do it, on occasion, and his return to from through the season has seen Liverpool really step up the goals.
What do you think?
Another thing related to better chances is location. I remember seeing some related analysis years ago, possibly during a world cup, about where most goals are scored from, and I think it was an area just off centre near the penalty spot.
But, I think theres a time element to this as well, ie how quickly a player can gain access to a location worth having a shot from, hence increasing the chances of a goal resulting.