Late season form for mid table teams
You don't hear it so much these days - or at least I don't, having left the world of 24/7 Sky Sports News to one in which my weekly football dose is received in 90 minute spells with little or no nonsense chat - but anytime a mid table team would lose towards the end of the season, we always heard that they had one eye on their upcoming holiday and had mentally checked out by late March. If this is indeed the case then the fantasy impact would be huge as (a) we would obviously wish to avoid such players and (b) playing someone like Swansea would suddenly become a potentially easier fixture than facing a team battling to stay in the league.
The below assessment is very simplistic and should not be taken as an attempt to definitively answer this question. It's merely a first attempt to shed a little bit of light on this topic and see if there's something here to investigate. The analysis contains a number of limitations, not limited to:
 The only obvious conclusion from the above chart is admittedly that nothing is obvious, but if you bear with me for a second, there are a couple of points to note:
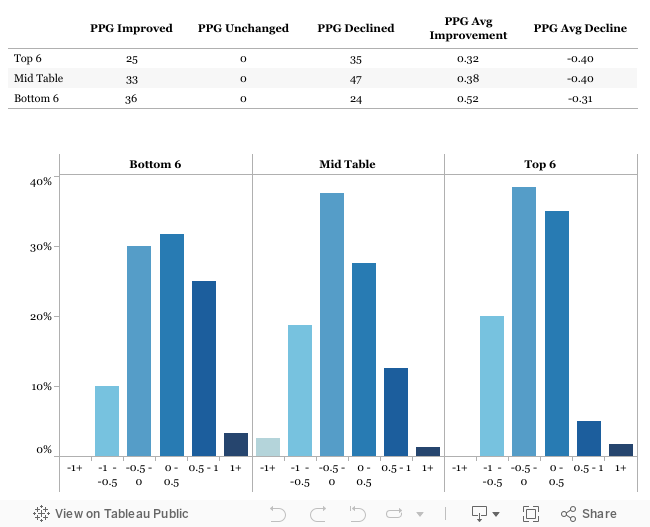 On the face of it, the above data is quite promising with regards to identifying a genuine trend of late season declines/surges. We see more decline among top six teams and more improvement among the bottom six teams, though this is to be expected as those teams have further to fall/rise and - at least at the very top - we will have some seasons where the best teams are resting players once the league is effectively over if they are involved in other competitions. The key though are those middle teams, who have shown a much higher propensity for declining (47/80) rather than improving (33/80), which seems to fit with the popular narrative.
Less exciting is the above chart which shows that the majority of mid table teams (66%) improving or declining by just 0.5 GPG either way, though again, this was always likely given that they have less scope to rise or fall. The fact that we have three teams who declined by a full point per game all within the mid table category, is however a plus.
So, it looks like we have something here, namely that mid table teams do appear more likely to decline than improve, presumably with the teams at the bottom of the league vulturing their points more often that not. Let's dig a bit deeper though and see how they improve/decline in terms of goals scored/conceded.
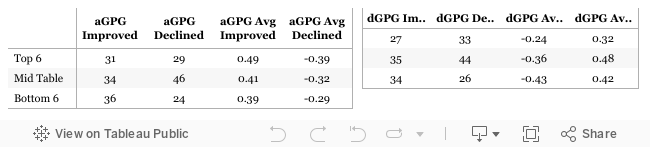
There are a few questions coming out of this data which might be worth looking at in a future post, but for now let's stick with those mid table teams. We can see that they lost ground both in terms of goals scored and goals conceded, though the decline on the defensive side was more pronounced with the average decline being close to half a goal per game conceded. This again fits with expectations as it's easier to stay focused on the attacking side of the pitch, while mundane marking from corners or tracking a midfield run might seem less important when the end result isn't overly important.
So what does this all mean? Well, that's hard to say on such a high level but I think there's enough here to at least give us pause for thought before buying someone from the Swanseas and Fulhams of the world (particularly on the defensive side of the pitch). Saying that though, it should be noted that even given the above, teams in the bottom six still conceded, on average, 0.2 GPG more than the mid table teams over the end of season run in, so replacing those mid table defenders will be tricky. Considering that the offensive declines have been lower across the board, it might be advisable to try and put less emphasis on defense, trying to grab a couple of premium players to start every week then spot starting one of the cheaper options where you can. History would suggest that a four, or even a five, man defense would be inadvisable during the late stages of the season.
The below assessment is very simplistic and should not be taken as an attempt to definitively answer this question. It's merely a first attempt to shed a little bit of light on this topic and see if there's something here to investigate. The analysis contains a number of limitations, not limited to:
- I have not adjusted for strength of schedule, so while I'm comparing a team's form through 30 weeks versus the final eight weeks, if teams happen to play the best eight teams in the league to end of the season and lose most of them, the analysis would flag this as an exception where as in reality such results were pretty much expected.
- I have not factored in anything surrounding managerial changes or player transfers so if you believe that January signing or interim manager turned a team around, this wouldn't necessarily be explained below.
- I have not gone into why teams are winning or losing, only the end results. As we know, results can be misleading when judging how well a team is playing, and mere randomness would account for some fluctuation in points, even a team continued to generate and concede the exact same number of chances every week.
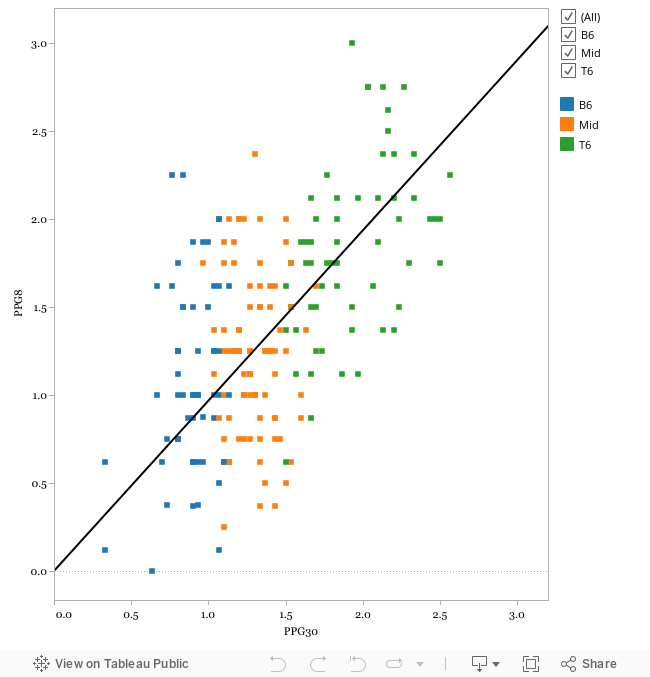
With those caveats in mind, let's take a look at the data. We have plotted the points per game of teams through the first 30 weeks of the season (PPG30) against their points per game through the final eight games (PPG8). I like this cutoff point as (a) it's the stage of the season we're at now and (b) by the 30 game mark you have a nice group of teams who are very likely safe but have little chance of making a run at a European spot (this year this is probably everyone between West Brom and Norwich). Our simple hypothesis would be that if a team averaged 1.8 PPG through the first 30 games, they should continue to do so through the final eight weeks (again, ignoring quality of opponent for a minute). What we would deem an interesting result is whether certain teams (say, those in the top six) continue to perform a ready rate, while others (say, those in mid table security) see a noticeable decline in results. For this reason, we have colour coded the chart to highlight each team's position at the 30 game mark (simply split between, top six (T6), mid table (mid) and the bottom six (B6):
- We've seen some pretty incredible changes in fortunes for teams at almost every position with teams like 06-07 Man United going from a 2.5 PPG average to 1.75 over the final 8 games, while 06-07 West Ham and 11-12 Wigan went from a 0.8 PPG average to finishing with championship form (2.25).
- While we have seen differences every season, there is clearly a strong trend here (r-squared = 0.88) so our starting point for teams should still be that we expect business as usual, rather than working on the assumption that the QPR and Readings of the world are all set for late season surges.
Let's pull some of the key trends from the data to see if anything else jumps out:
Less exciting is the above chart which shows that the majority of mid table teams (66%) improving or declining by just 0.5 GPG either way, though again, this was always likely given that they have less scope to rise or fall. The fact that we have three teams who declined by a full point per game all within the mid table category, is however a plus.
So, it looks like we have something here, namely that mid table teams do appear more likely to decline than improve, presumably with the teams at the bottom of the league vulturing their points more often that not. Let's dig a bit deeper though and see how they improve/decline in terms of goals scored/conceded.
There are a few questions coming out of this data which might be worth looking at in a future post, but for now let's stick with those mid table teams. We can see that they lost ground both in terms of goals scored and goals conceded, though the decline on the defensive side was more pronounced with the average decline being close to half a goal per game conceded. This again fits with expectations as it's easier to stay focused on the attacking side of the pitch, while mundane marking from corners or tracking a midfield run might seem less important when the end result isn't overly important.
So what does this all mean? Well, that's hard to say on such a high level but I think there's enough here to at least give us pause for thought before buying someone from the Swanseas and Fulhams of the world (particularly on the defensive side of the pitch). Saying that though, it should be noted that even given the above, teams in the bottom six still conceded, on average, 0.2 GPG more than the mid table teams over the end of season run in, so replacing those mid table defenders will be tricky. Considering that the offensive declines have been lower across the board, it might be advisable to try and put less emphasis on defense, trying to grab a couple of premium players to start every week then spot starting one of the cheaper options where you can. History would suggest that a four, or even a five, man defense would be inadvisable during the late stages of the season.

Comments
I'd like to see if you could keep hold of your projections for the rest of the season and then compare them to realised results and see if you notice a difference in results from now on compared to the rest of the season.