Regression to the mean: goals per shot on target
The purpose of this post is two-fold. First, I want to illustrate a point I've made before in graphical form and highlight a couple of players coming out of that analysis. Second, I want to give a little bit of narrative around regression to the mean and issue a word of caution as to where I'm seeing it misapplied fairly regularly in these stat-friendly times.
From some quick research over the top forwards in the league, we see that, generally, they haven't really shown an ability to consistently convert shots on target (SoT) into goals above the league average rate. The league average hovers around the 33% mark for forwards and 28% mark for midfielders, with very few players able to exceed those totals each year (and even then that would be expected purely based on statistical variance). In short then, whether it seems intuitive or not, if a player's SoT are turning into goals at a very high rate, we must expect some regression in the coming weeks.
Now then, a quick side bar as to what we mean by this, as this term is often misused and the difference can appear trivial but is actually key (long term readers will know that I too made this mistake once myself so this isn't the rant of a classically trained statistician, outraged that the masses are misusing his darling tools, more a warning message for those trying to use statistical analysis a bit more in their weekly decision making).
The first point is that regression accounts for what should happen in the future and has no interest in correcting for past anomalies. Take, for example, the basketball player with a career free throw percentage of 80% who hasn't suffered any significant ageing or reasons for decline/improvement. If, after half a season he's taken 100 free throws and made 70 of them (70%) what do we expect from his second half? To get his year end average back up to his career 80% rate he'd have to go 90/100 to give him 160/200 for the year, or 80%. But, on what basis will he suddenly perform above his career rate? Averages and regression care not for your 82 game sample size (or, in our case, 38 games) and thus it's simply not true to say we expect his season rate to regress all the way back to his 80% conversion rate. Instead, we expect the rest of the season to see him convert at his true talent level of 80%.
Let's look at a football example for clarity. Through eleven gameweeks, Wayne Rooney has hit the target 12 times and scored twice (17%). To get back to that 34% mark noted above, Rooney would have to convert six of his next 12 shots to give him the eight goals needed from 24 shots (33%), but that's not what we expect. We expect him to convert at that same 33% rate so four of his next 12 shots would be goals. This may sound pedantic but just in this crude example it's the difference between Rooney scoring four and six goals over a relatively short time frame and can obviously have a large impact on our forecasts.
We can however say that if player x is getting a lot of shooting opportunities and continues to do so, he should convert at a better rate than he has to date and thus appears undervalued by the market. It's a subtle distinction but an important one that needs making every now and again.
The second, and somewhat trivial point to make is that regression goes both ways so Rooney's conversion rate can regress up to the mean, rather than always having to cite the Steve Fletchers of the world whose conversion rate looks unsustainable and thus is pegged fro downwards regression.
Okay then, onto some data.
The below chart plots players' total shots per 90 minutes on the x axis against their goals per shot on target percentage on the y axis. The lines mark the league average for both measures for all forwards this year (the G/SoT% includes several years' data):
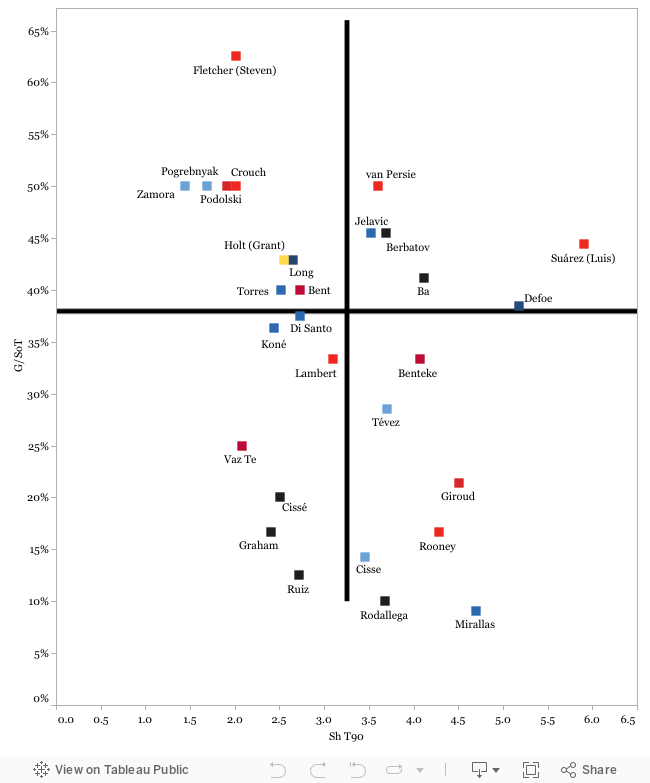 If you're below the line you've converted SoT into goals at a lower than expected rate and thus have the potential to be undervalued by the market. Those in the bottom right quadrant are particularly attractive as by taking more shots per game we (a) have a larger sample size to suggest they've been - for want of a better word, "unlucky" - and (b) they should get more opportunities to enjoy more league average success in the future. Indeed, this quadrant consists of several players I've highlighted of late, led by Rooney and Aguero but also recent Moneyball candidate Cisse and a couple of players who've made appearances in a couple of fanning the flames like Giroud and Benteke.
The bottom left if harder to be excited about as while they should convert at a higher rate in the future, their overall lack of chances may ultimately mean it doesn't make too much difference and thus they're tough to own. This is particularly true of someone like P Cisse, as while he appears to have been unfortunate in converting his chances, even at a league average rate he would have scored only one more goal, clearly not enough to justify his lofty price tag.
The top left quadrant is the real concern as this group appears to have overachieved versus league average in terms of G/SoT% so unless you believe they have a genuine skill to continue to do so, we're expecting some regression in the coming weeks and months. Fletcher is the stand out man here whose 63% conversion rate is clearly unsustainable, even for a player who has shown an ability to exceed the league average over the years. This data needs to be taken in context as someone like Crouch could still offer some value if he converted at a lower rate but care should be taken before we anoint anyone from this group as great fantasy options.
The top right quadrant is a mixed bag and one you'd label with 'caution' rather than a full on 'warning'. Take Berbatov for example. With five goals from just 11 SoT, his 45% rate looks a touch high and of his next 11 SoT we'd expect only 3.6 to hit the back of the net. However, for a cheaper player who comes with job security, genuine talent and who's getting more than the average total shots per game, that rate would still potentially make him good value and forecast him for a further 14 goals if he played every game from here on (1.57 SoT/90minutes x 27 games x 33% conversion rate). The caution more comes within players like Suarez or even the great van Persie who are getting a lot of hype and, while excellent prospects, might be getting a touch overvalued based on their production to date. Again, it's all relative as using the same calculation as for Berbatov, van Persie would still be on pace for another 13 goals even at a league average rate, but that is substantially less than some are foreseeing.
One final note here. You might wonder why I'm plotting SoT% against total shots per 90 minutes rather than only shots on target. It's a valid point but I've used total shots as my concern with only using SoT is that the sample sizes are so small that extrapolating them can get messy quickly. I'm more comfortable therefore to add the required note that not every shot is created equal, rather than relying on Benteke's six SoT and drawing too many inferences (with 24 total shots and 22 SiB one can expect a better on target rate in the future too).
As with pretty much every piece of analysis I post, other than the final model forecasts, the above should not be taken as 'sell player x' or 'buy player y' but more a way of identifying players to look closer at, one way or another. It doesn't, for instance, factor in strength of schedule played or upcoming, assist potential and a myriad of other factors, so it shouldn't be taken out of context. I like it's visual simplicity though and it's nice way to identify players and think "I didn't realise player x was benefiting from high shot conversion, maybe I should look closer at his stats".
From some quick research over the top forwards in the league, we see that, generally, they haven't really shown an ability to consistently convert shots on target (SoT) into goals above the league average rate. The league average hovers around the 33% mark for forwards and 28% mark for midfielders, with very few players able to exceed those totals each year (and even then that would be expected purely based on statistical variance). In short then, whether it seems intuitive or not, if a player's SoT are turning into goals at a very high rate, we must expect some regression in the coming weeks.
Now then, a quick side bar as to what we mean by this, as this term is often misused and the difference can appear trivial but is actually key (long term readers will know that I too made this mistake once myself so this isn't the rant of a classically trained statistician, outraged that the masses are misusing his darling tools, more a warning message for those trying to use statistical analysis a bit more in their weekly decision making).
The first point is that regression accounts for what should happen in the future and has no interest in correcting for past anomalies. Take, for example, the basketball player with a career free throw percentage of 80% who hasn't suffered any significant ageing or reasons for decline/improvement. If, after half a season he's taken 100 free throws and made 70 of them (70%) what do we expect from his second half? To get his year end average back up to his career 80% rate he'd have to go 90/100 to give him 160/200 for the year, or 80%. But, on what basis will he suddenly perform above his career rate? Averages and regression care not for your 82 game sample size (or, in our case, 38 games) and thus it's simply not true to say we expect his season rate to regress all the way back to his 80% conversion rate. Instead, we expect the rest of the season to see him convert at his true talent level of 80%.
Let's look at a football example for clarity. Through eleven gameweeks, Wayne Rooney has hit the target 12 times and scored twice (17%). To get back to that 34% mark noted above, Rooney would have to convert six of his next 12 shots to give him the eight goals needed from 24 shots (33%), but that's not what we expect. We expect him to convert at that same 33% rate so four of his next 12 shots would be goals. This may sound pedantic but just in this crude example it's the difference between Rooney scoring four and six goals over a relatively short time frame and can obviously have a large impact on our forecasts.
We can however say that if player x is getting a lot of shooting opportunities and continues to do so, he should convert at a better rate than he has to date and thus appears undervalued by the market. It's a subtle distinction but an important one that needs making every now and again.
The second, and somewhat trivial point to make is that regression goes both ways so Rooney's conversion rate can regress up to the mean, rather than always having to cite the Steve Fletchers of the world whose conversion rate looks unsustainable and thus is pegged fro downwards regression.
Okay then, onto some data.
The below chart plots players' total shots per 90 minutes on the x axis against their goals per shot on target percentage on the y axis. The lines mark the league average for both measures for all forwards this year (the G/SoT% includes several years' data):
The bottom left if harder to be excited about as while they should convert at a higher rate in the future, their overall lack of chances may ultimately mean it doesn't make too much difference and thus they're tough to own. This is particularly true of someone like P Cisse, as while he appears to have been unfortunate in converting his chances, even at a league average rate he would have scored only one more goal, clearly not enough to justify his lofty price tag.
The top left quadrant is the real concern as this group appears to have overachieved versus league average in terms of G/SoT% so unless you believe they have a genuine skill to continue to do so, we're expecting some regression in the coming weeks and months. Fletcher is the stand out man here whose 63% conversion rate is clearly unsustainable, even for a player who has shown an ability to exceed the league average over the years. This data needs to be taken in context as someone like Crouch could still offer some value if he converted at a lower rate but care should be taken before we anoint anyone from this group as great fantasy options.
The top right quadrant is a mixed bag and one you'd label with 'caution' rather than a full on 'warning'. Take Berbatov for example. With five goals from just 11 SoT, his 45% rate looks a touch high and of his next 11 SoT we'd expect only 3.6 to hit the back of the net. However, for a cheaper player who comes with job security, genuine talent and who's getting more than the average total shots per game, that rate would still potentially make him good value and forecast him for a further 14 goals if he played every game from here on (1.57 SoT/90minutes x 27 games x 33% conversion rate). The caution more comes within players like Suarez or even the great van Persie who are getting a lot of hype and, while excellent prospects, might be getting a touch overvalued based on their production to date. Again, it's all relative as using the same calculation as for Berbatov, van Persie would still be on pace for another 13 goals even at a league average rate, but that is substantially less than some are foreseeing.
One final note here. You might wonder why I'm plotting SoT% against total shots per 90 minutes rather than only shots on target. It's a valid point but I've used total shots as my concern with only using SoT is that the sample sizes are so small that extrapolating them can get messy quickly. I'm more comfortable therefore to add the required note that not every shot is created equal, rather than relying on Benteke's six SoT and drawing too many inferences (with 24 total shots and 22 SiB one can expect a better on target rate in the future too).
As with pretty much every piece of analysis I post, other than the final model forecasts, the above should not be taken as 'sell player x' or 'buy player y' but more a way of identifying players to look closer at, one way or another. It doesn't, for instance, factor in strength of schedule played or upcoming, assist potential and a myriad of other factors, so it shouldn't be taken out of context. I like it's visual simplicity though and it's nice way to identify players and think "I didn't realise player x was benefiting from high shot conversion, maybe I should look closer at his stats".

Comments
This is like looking at a roulette table and going "After 100 spins there still haven't been a 24, so the probability of that happening is much higher than before". Even if you consider all players to be equal finishers then they would still only be expected to perform at the league average in the future (not above/below depending on their history). If you counter in the fact people who have been wasteful with their shots in the past are more likely to be wasteful with shots in the future, that scoring goals gives confidence and permission to shoot more, then I really wouldn't focus on picking up the bottom right players.
Some of them though are possible budget targets such as Mirallas and Benteke.
As I said in the piece, I am not saying this chart highlights buy or sell options, only that those whose SoT% is below average have possibly been unlucky and thus we need to dig deeper into their stats before writing them off.
No one is 'due' a goal, it's just that while everyone is raving about the likes of Jelavic, the chart suggests someone like Cisse COULD be equally valuable as the only difference to date is luck (assuming we buy the premise that SoT are converted at a consistent rate which is still a theory). We need to look at their split of shots in/outside the box and their ability to the hit the target too, but that's just too much to throw into a simple graph (I do account for all that in the model though).
Does that make sense? It's tough to get across what I mean sometimes.
How about making a plot in the lines of Price plotted against SoT (/90 or overall). This should point out the players who are overpriced based on performance.
Btw bad luck on dropping Podolski this week. Sure hopes Berba delivers as I have him myself, but anyway I think it is a better option for the long term.