Defensive +/- SiB
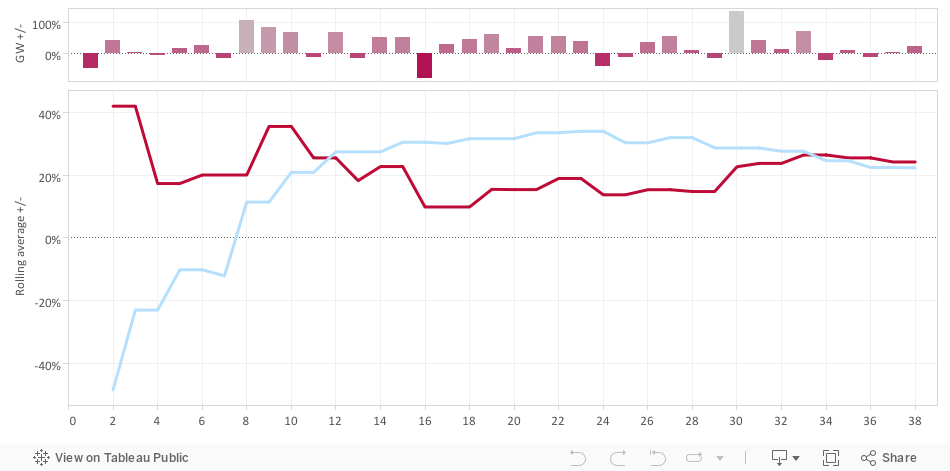
We looked at this similar data for team shots generated a few weeks back, but as a reminder, this below +/- data is calculated as below:
If Arsenal have faced Stoke, Southampton and West Ham who had, on average, managed 8, 12 and 10 shots inside the box (SiB) but Arsenal surrendered 6, 14 and 9, we would record a +/- of -25%, 17% and -10%. We then just take a simple average to give us an overall rating of -6% for these games. Note that from a defensive perspective a minus number is good as it represents less shots surrendered than the league average.
By plotting this data against actual goals conceded per game (GPG), we might be able to identify teams whose results have fallen short of their underlying performance and thus might be poised for some improved results (or vice versa). The data has been split between home and away given that some teams present significant distinctions at home and away. The size of each plotted square represents the total SiB surrendered (at home/away).
We would expect teams with a low GPG to also have a low SiB +/- and then generally follow a diagonal line so that teams with a high GPG have a high +/-. We haven't done enough work to understand the exact relationship here, but generally, the further from this somewhat arbitrary trend line, the more potential for regression in a team's results.
Potential gains
LIV (H) aren't really considered an elite defense anymore but their ability to limit opponents at home has been excellent. They've limited every opponent but one to at least -30% and have topped -50% on four occasions (MUN, STK, RDG and WIG). They've quietly added three clean sheets at home and those totals could get even better if Liverpool can continue to restrict opponents like they have to date (they welcome SOU, AVL, FUL, SUN and NOR to Anfield in the next five home games).
ARS (H) are a tough to forecast here without getting caught up with narratives, as while the data shows they've been solid and a touch 'unlucky' (for want of a better term), we often hear how they make individual mistakes and can be exposed at the back, which it's easy to see as a convenient explanation for this data. The results against CHE (three SiB, two goals) and FUL (seven SiB, three goals) look like outliers in a vacuum but there is something to be said for a team with Arsenal's attacking philosophy not necessarily being able to convert few chances conceded into clean sheets (the chances they surrender have a higher chance of being on the counter attack which could be converted at a higher rate: more research is required in this area).
MCI (A) away from home have been outstanding, registering four performance of -40% or better and were finally rewarded with their first away clean sheet in GW10. This data shows how City have the potential to be a defense you can start with confidence every week, if they can eliminate the errors which have seen them concede the odd untimely goal.
Potential losses
WBA (H) have emerged as feel good story of the season so far, but as the excellent work from Simon Gleave shows, their results versus last season haven't really shown much improvement. We can also see that their defensive results appear somewhat unsustainable, especially when we see that two of their three clean sheets at home came after surrendering 10 and 12 SiB against Liverpool and Everton. In their defense, two of their worse games came against MCI and CHE where one wouldn't really expect too much joy anyway, but still, there is a cautionary tale to not get carried away with this team's prospects just yet.
EVE (H) are a surprise inclusion here as they are seen as a fairly solid defensive unit but they haven't had a really good game at home all year (the clean sheet against MUN still only gave them a -7% rating). Part of this data is skewed by this week's performance against SUN who have otherwise been miserable on the road, but however you cut it, Everton haven't really impressed defensively and this adds weight to my long running questioning of Baines' valuation.
SUN (A) have somehow managed to accrue two clean sheets despite registering just one better than average performance (in which they actually conceded twice to SWA). Against Stoke they conceded 11 SiB yet somehow snuck away with a clean sheet, much like their surprising blank at ARS in GW1 (again, surrendering a worrying 13 SiB).
The usual caveat applies here, as this is just one metric and one way to measure teams' performance but it hopefully sparks a few thoughts and allows us to dig a little deeper where needed. For reference, the full data is below:

Comments
I am beginning to wonder whether SiB data can significantly help us when deciding who would be good for a clean sheet. The cliché that it only takes a second to concede a goal is nevertheless true and it only takes one lapse in concentration or a piece or extreme skill and/or luck for a goal to be scored at any time during a game.
It's perhaps obvious but worth mentioning that SiB data doesn't take into account the quality of the shots. If a defender does excellently to put off an attacker who's shooting or limits the attacker to shooting from difficult positions, this information doesn't show up in the analysis.
The question of whether goals conceded really translates into clean sheets is an interesting one, as there are strong narratives (and indeed likely truth) to suggest that if, say, you're winning 2-0, you wouldn't perhaps try as hard to prevent the first goal being conceded as you would a potential tying second. That said, the correlation between goals and clean sheets is 90% with an 81% r-squared and you have to think that pure statistical variance accounts for at least part of the gap.
There's more work to be done here, but not surrendering SiB goes a long was to a team having defensive success and thus I think it's a useful building block on which to build a model.
A. Ba (quality striker, explosive, in-form, sou nxt )
B. Giroud ( differential, fixtures, more potent attack)
plz help me out here..
Keep up the good work!