Expected Goals - a comparison with Opta
The popularity of "expected goals" as a metric has exploded over the past year or so, with mainstream TV broadcasts now starting to dip their toes in the water of advanced analytics. One inevitable, if slightly unfortunate, consequence is that there are now multiple xG models, which could potentially disagree by a reasonable amount, which to those who need a bit more persuasion as to the merits of statistical analysis, might suggest a lack of accuracy. This has somewhat been the case in baseball with the two big "Wins Above Replacement" (WAR) metrics sometimes disagreeing by a relatively large amount, especially when it comes to valuing pitchers. There is sound methodology behind each metric, of course, but for those who aren't well versed in the intricacies of the debate, the differences can be distracting and serve as fuel for those who want to dismiss analytics and focus on old fashioned "eyeball tests" etc.
I, of course, have my own model which probably predates a lot that are currently around but also lacks some of complexity that is now possible with the proliferation of individual event-by-event data from Opta, which allows one to do a better job at understanding the likelihood of a goal based on the exact location of a shot. My concern is that this model is confusing issues, although with my readership of 15 people against the millions of people exposed to Opta stats, this isn't a huge concern!
Nevertheless, let's first take a look at how different my model is than Opta's, then have a look at a few examples of the kind of player my model gets wrong, and then finally a few words on why you should continue (or start!) to care about the projected data in these electronic pages.
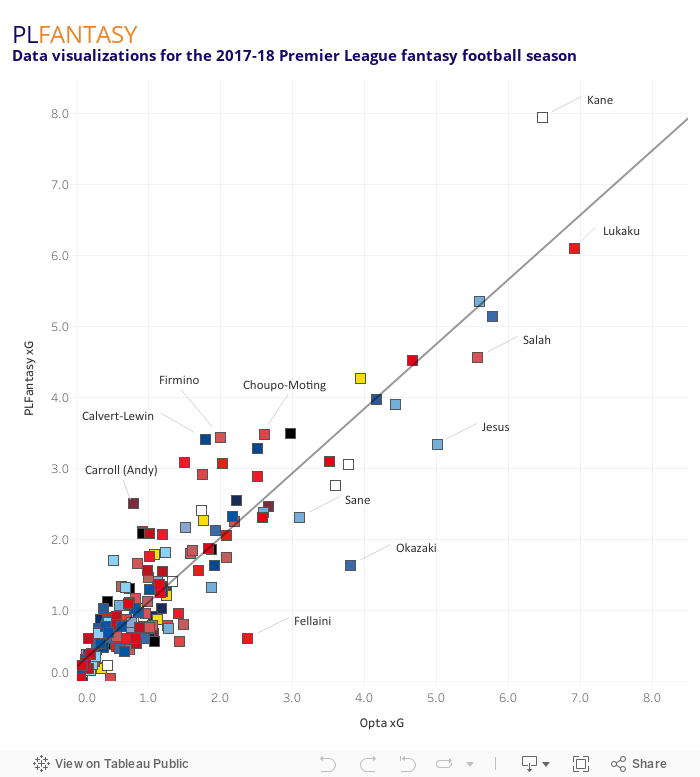 The above data is only based on 2017-18 data and the correlation looks very promising (an 88% r-squared is likely distorted a bit by a high volume of players with very low xG, but still, you can see a strong correlation between the two models and not many wild outliers), especially as there is still something of a small sample size issue with just 10 games in the bag. In terms of looking historically to analyse a game that has happened there is no argument that the Opta model is more sophisticated than mine but I am happy that the data here shows that what I've been offering is at least based in science and comparable to those more learned than I (thanks to ill advised transfers and a failure to heed my own advice, the league position of my own fantasy team doesn't always give the same assurances).
We can however see a few names whose xG varies quite significantly between the models and I want to highlight a couple of these to illustrate where my numbers need to be taken a pinch of salt:
Harry Kane vs Romelu Lukaku
Readers will know that my model loves Kane and he's been the top ranked player for much of the season. However the Opta model liks Lukaku a little more to date with the United man being worth almost a half goal more than his Spurs rival. In terms of sheer volume of shots, this outcome is hard to compute, with Kane taking 20 more shots than Lukaku and outshooting him 38 to 31 inside the box (all in one game fewer after this week's hamstring issue). If you want to take one step further away from shots then Kane still enjoys an advantage with 67 touches in the box to Lukaku's 54. Opta's model therefore must see some additional value in the quality of those chances, which is somewhat hinted at in his 12 big chances compared to Kane's 10. United have been more clinical, converting 18/29 (62%) of their big chances and 21/94 (22%) of their SiB compared to marks of 11/20 (55%) and 16/98 (16%) respectively for Spurs, though this argument gets a bit circular as others would argue that this efficiency is an effect of Lukaku's presence rather than Lukaku's conversion rate being a product of the team.
In short, the difference here isn't huge but is noteworthy and I will try and tweak my model a bit to increase the weighting given to team conversion rates (this data is factored in, but especially at this early stage of the season I heavily regress it back to league averages).
Man City
I feel like everything I write this season includes a section on Harry Kane and Man City and so here we go again. We can see that the Opta model rates Sane and Jesus's seasons significantly higher than mine, though interestingly Sterling and particularly Aguero are much closer (with the Argentine being almost 1:1). Like Lukaku above, this is almost certainly a recognition of the quality of City's chances, although watching the games I would have thought Sterling would really benefit from this as he seems to have gotten multiple tap ins this year with his pace enabling him to catch up with counter attacks and arrive at the far post for a square ball and easy goal. Still, this one makes total sense and will again be helped by an increased weighting in team conversion rates. Although, I don't think folks really need a model to tell them that this team is red hot, and the decision is really between Sane, Silva and Sterling or Aguero and Jesus, and adjusting the team rate wouldn't help you there.
Dominic Calvert-Lewin, Eric Maxim Choupo-Moting and Andy Carroll
This unlikely group of players is a cautionary tale of over-valuing solid stats from players on poor teams and could possibly be awarded the Adel Taarabt Memorial Trophy. I will focus on Calvert-Lewin because I own him and have thus paid most attention to his games (enduring 90 minutes of Everton with regularity is true dedication). The leaderboard among forwards in SiB goes Kane, Lukaku, Aguero, Morata, Lacazette, Calvert-Lewin, Jesus. One of those things is not like the others. That group ranks 1st, 2nd, 3rd, 4th, 6th and 10th among forwards in fantasy points and Lazazette has the worst goal haul with five. Calvert-Lewin is 25th among forwards with a measly 25 points and zero goals. Here I think the issue is both a team problem (Everton have converted just 6/66 (9%) SiB) and Calvert-Lewin himself, who just doesn't seem to be taking quality shots and, watching the games, he is lively but really doesn't seem like someone with crippling bad luck. He's hit the target six times, which in a vacuum would suggest more like 1-2 goals rather than zero, and there remains solid reasons for not overly focusing on SoT over SiB due to small sample size noise, but still, I think there's probably a gap in the model and also in my common sense in overly relying on it when it comes to players racking up shot totals without digging a little deeper as to their quality. This one is harder to fix without the advanced data so it might just be a case of raising those flags before highlighting this kind of player for potential success.
Looking forward
The pleasing thing about this bit of analysis is that while we can definitely identify blind-spots in my model, it's close enough to the Opta version to suggest we're on the right path. The reason this is exciting is because by basing the xG on simple events like shots and SiB, I feel we have a good chance at predicting future xG, which becomes trickier if you are trying to forecast not only how many shots Harry Kane will get, but where he will take them from, where the defenders will be, who passed to him etc. I hope that team shot data stabilises relatively quickly and is less impacted by individual idiosyncratic events and thus we can use it with some certainty to predict team totals which can be allocated to each player to give us our predicted shots to form the basis of xG.
I am not of course suggesting in any way that my model is as good as some of the others out there at determining why what happened, happened, but in terms of translating that data into predictive information I think we're in a good place and I'm fairly happy with how the model is working for now.
I, of course, have my own model which probably predates a lot that are currently around but also lacks some of complexity that is now possible with the proliferation of individual event-by-event data from Opta, which allows one to do a better job at understanding the likelihood of a goal based on the exact location of a shot. My concern is that this model is confusing issues, although with my readership of 15 people against the millions of people exposed to Opta stats, this isn't a huge concern!
Nevertheless, let's first take a look at how different my model is than Opta's, then have a look at a few examples of the kind of player my model gets wrong, and then finally a few words on why you should continue (or start!) to care about the projected data in these electronic pages.
We can however see a few names whose xG varies quite significantly between the models and I want to highlight a couple of these to illustrate where my numbers need to be taken a pinch of salt:
Harry Kane vs Romelu Lukaku
Readers will know that my model loves Kane and he's been the top ranked player for much of the season. However the Opta model liks Lukaku a little more to date with the United man being worth almost a half goal more than his Spurs rival. In terms of sheer volume of shots, this outcome is hard to compute, with Kane taking 20 more shots than Lukaku and outshooting him 38 to 31 inside the box (all in one game fewer after this week's hamstring issue). If you want to take one step further away from shots then Kane still enjoys an advantage with 67 touches in the box to Lukaku's 54. Opta's model therefore must see some additional value in the quality of those chances, which is somewhat hinted at in his 12 big chances compared to Kane's 10. United have been more clinical, converting 18/29 (62%) of their big chances and 21/94 (22%) of their SiB compared to marks of 11/20 (55%) and 16/98 (16%) respectively for Spurs, though this argument gets a bit circular as others would argue that this efficiency is an effect of Lukaku's presence rather than Lukaku's conversion rate being a product of the team.
In short, the difference here isn't huge but is noteworthy and I will try and tweak my model a bit to increase the weighting given to team conversion rates (this data is factored in, but especially at this early stage of the season I heavily regress it back to league averages).
Man City
I feel like everything I write this season includes a section on Harry Kane and Man City and so here we go again. We can see that the Opta model rates Sane and Jesus's seasons significantly higher than mine, though interestingly Sterling and particularly Aguero are much closer (with the Argentine being almost 1:1). Like Lukaku above, this is almost certainly a recognition of the quality of City's chances, although watching the games I would have thought Sterling would really benefit from this as he seems to have gotten multiple tap ins this year with his pace enabling him to catch up with counter attacks and arrive at the far post for a square ball and easy goal. Still, this one makes total sense and will again be helped by an increased weighting in team conversion rates. Although, I don't think folks really need a model to tell them that this team is red hot, and the decision is really between Sane, Silva and Sterling or Aguero and Jesus, and adjusting the team rate wouldn't help you there.
Dominic Calvert-Lewin, Eric Maxim Choupo-Moting and Andy Carroll
This unlikely group of players is a cautionary tale of over-valuing solid stats from players on poor teams and could possibly be awarded the Adel Taarabt Memorial Trophy. I will focus on Calvert-Lewin because I own him and have thus paid most attention to his games (enduring 90 minutes of Everton with regularity is true dedication). The leaderboard among forwards in SiB goes Kane, Lukaku, Aguero, Morata, Lacazette, Calvert-Lewin, Jesus. One of those things is not like the others. That group ranks 1st, 2nd, 3rd, 4th, 6th and 10th among forwards in fantasy points and Lazazette has the worst goal haul with five. Calvert-Lewin is 25th among forwards with a measly 25 points and zero goals. Here I think the issue is both a team problem (Everton have converted just 6/66 (9%) SiB) and Calvert-Lewin himself, who just doesn't seem to be taking quality shots and, watching the games, he is lively but really doesn't seem like someone with crippling bad luck. He's hit the target six times, which in a vacuum would suggest more like 1-2 goals rather than zero, and there remains solid reasons for not overly focusing on SoT over SiB due to small sample size noise, but still, I think there's probably a gap in the model and also in my common sense in overly relying on it when it comes to players racking up shot totals without digging a little deeper as to their quality. This one is harder to fix without the advanced data so it might just be a case of raising those flags before highlighting this kind of player for potential success.
Looking forward
The pleasing thing about this bit of analysis is that while we can definitely identify blind-spots in my model, it's close enough to the Opta version to suggest we're on the right path. The reason this is exciting is because by basing the xG on simple events like shots and SiB, I feel we have a good chance at predicting future xG, which becomes trickier if you are trying to forecast not only how many shots Harry Kane will get, but where he will take them from, where the defenders will be, who passed to him etc. I hope that team shot data stabilises relatively quickly and is less impacted by individual idiosyncratic events and thus we can use it with some certainty to predict team totals which can be allocated to each player to give us our predicted shots to form the basis of xG.
I am not of course suggesting in any way that my model is as good as some of the others out there at determining why what happened, happened, but in terms of translating that data into predictive information I think we're in a good place and I'm fairly happy with how the model is working for now.

Comments